
How Unified Dashboards Drive Better Operational Decisions
Why leadership teams make faster, calmer decisions when project, people, and workload data share one view.

Overview
Most operational decisions are not hard because the options are complex. They are hard because the information needed to choose sits in different systems, in different formats, updated on different schedules. A delivery date lives in the project tracker, team availability in the HR system, and actual hours in a timesheet tool. By the time someone has assembled the picture, it is already out of date.
A unified dashboard changes the nature of the conversation. Instead of debating whose spreadsheet is correct, a leadership team starts from a shared, current view and spends its time on the decision itself.

- Decisions speed up when the assembly step disappears.
- Cross-system views expose problems that single-tool reports hide.
- Shared visibility reduces the status meetings that exist only to synchronize information.
The Cost of Fragmented Reporting
When reporting is stitched together by hand, three things reliably go wrong. Reports arrive late, because someone has to export, merge, and format them. Reports disagree, because each tool counts things slightly differently. And reports get quietly distrusted, because everyone has seen them be wrong before.
The organizational response to distrusted reports is more meetings: status calls, check-ins, and pre-meetings to align on numbers before the real meeting. That is time spent reconstructing reality rather than acting on it.
What Unified Actually Means
A unified dashboard is not simply many charts on one screen. The value comes from the data underneath sharing definitions and updating from the systems where work actually happens. If the utilization figure and the project-margin figure both derive from the same time entries, they cannot contradict each other, and nobody has to arbitrate between them.
This is why consolidation matters more than visualization. Platforms like Workefy that unify project planning, HR, and time tracking can show workload, availability, and delivery status from a single underlying record of work, so the dashboard is a live view rather than a periodic report.
From Reporting Backwards to Steering Forwards
Fragmented reporting is inherently retrospective: by the time the numbers are assembled, they describe last week. A unified view shifts the time horizon. When capacity, commitments, and progress update continuously, leadership can see a problem forming, such as a team drifting toward overload three weeks out, while there is still time to change course cheaply.
That forward view also changes the tone of operational discussions. Instead of assigning blame for a slip that already happened, the conversation becomes about which lever to pull next. Teams consistently report that this is the cultural difference between reporting and steering.
- Views that earn their place:
- Capacity versus commitment: who is overloaded, and which planned work has no owner.
- Delivery health: schedule slip and blocked items surfaced from live task data.
- Pipeline versus resourcing: whether the team can staff the work that is about to arrive.
- Habits that make dashboards useful:
- Review the same view in every leadership meeting, so trends become visible.
- Fix data at the source when a number looks wrong, instead of correcting the chart.
- Retire any widget nobody has acted on in a quarter.
- Traps to avoid:
- Metric sprawl: twenty charts hide the three that matter.
- Manual feeds: any number pasted in by hand will eventually be stale.
- Private dashboards: visibility only changes behavior when it is shared.

Getting Started
Begin with one decision you make repeatedly, not with a tool.
Pick a recurring question, such as whether to take on new work next month, and build the smallest view that answers it from live data. Connect the systems involved, agree definitions, and use the view in a real meeting. Definitions are the hard part: utilisation means nothing until you have settled what a billable hour records. Expand only when that first view has earned trust.
Expect the first weeks to surface uncomfortable findings: numbers that were quietly wrong, workloads that were heavier than anyone admitted, projects that were healthier on the slide than in reality. That discomfort is the dashboard doing its job. Treat every discrepancy as a data-quality fix rather than a fault-finding exercise, and trust in the shared view will compound. Most people-side discrepancies trace back to the absence of a single system of record, which is the problem an HRIS exists to solve.
Unified dashboards do not make decisions for you. What they do is remove the argument about what is true, so the people in the room can spend their attention on what to do about it. For most operations teams, that is the single largest upgrade available to their decision-making, and it comes from consolidation, not from another reporting layer.
Related reading
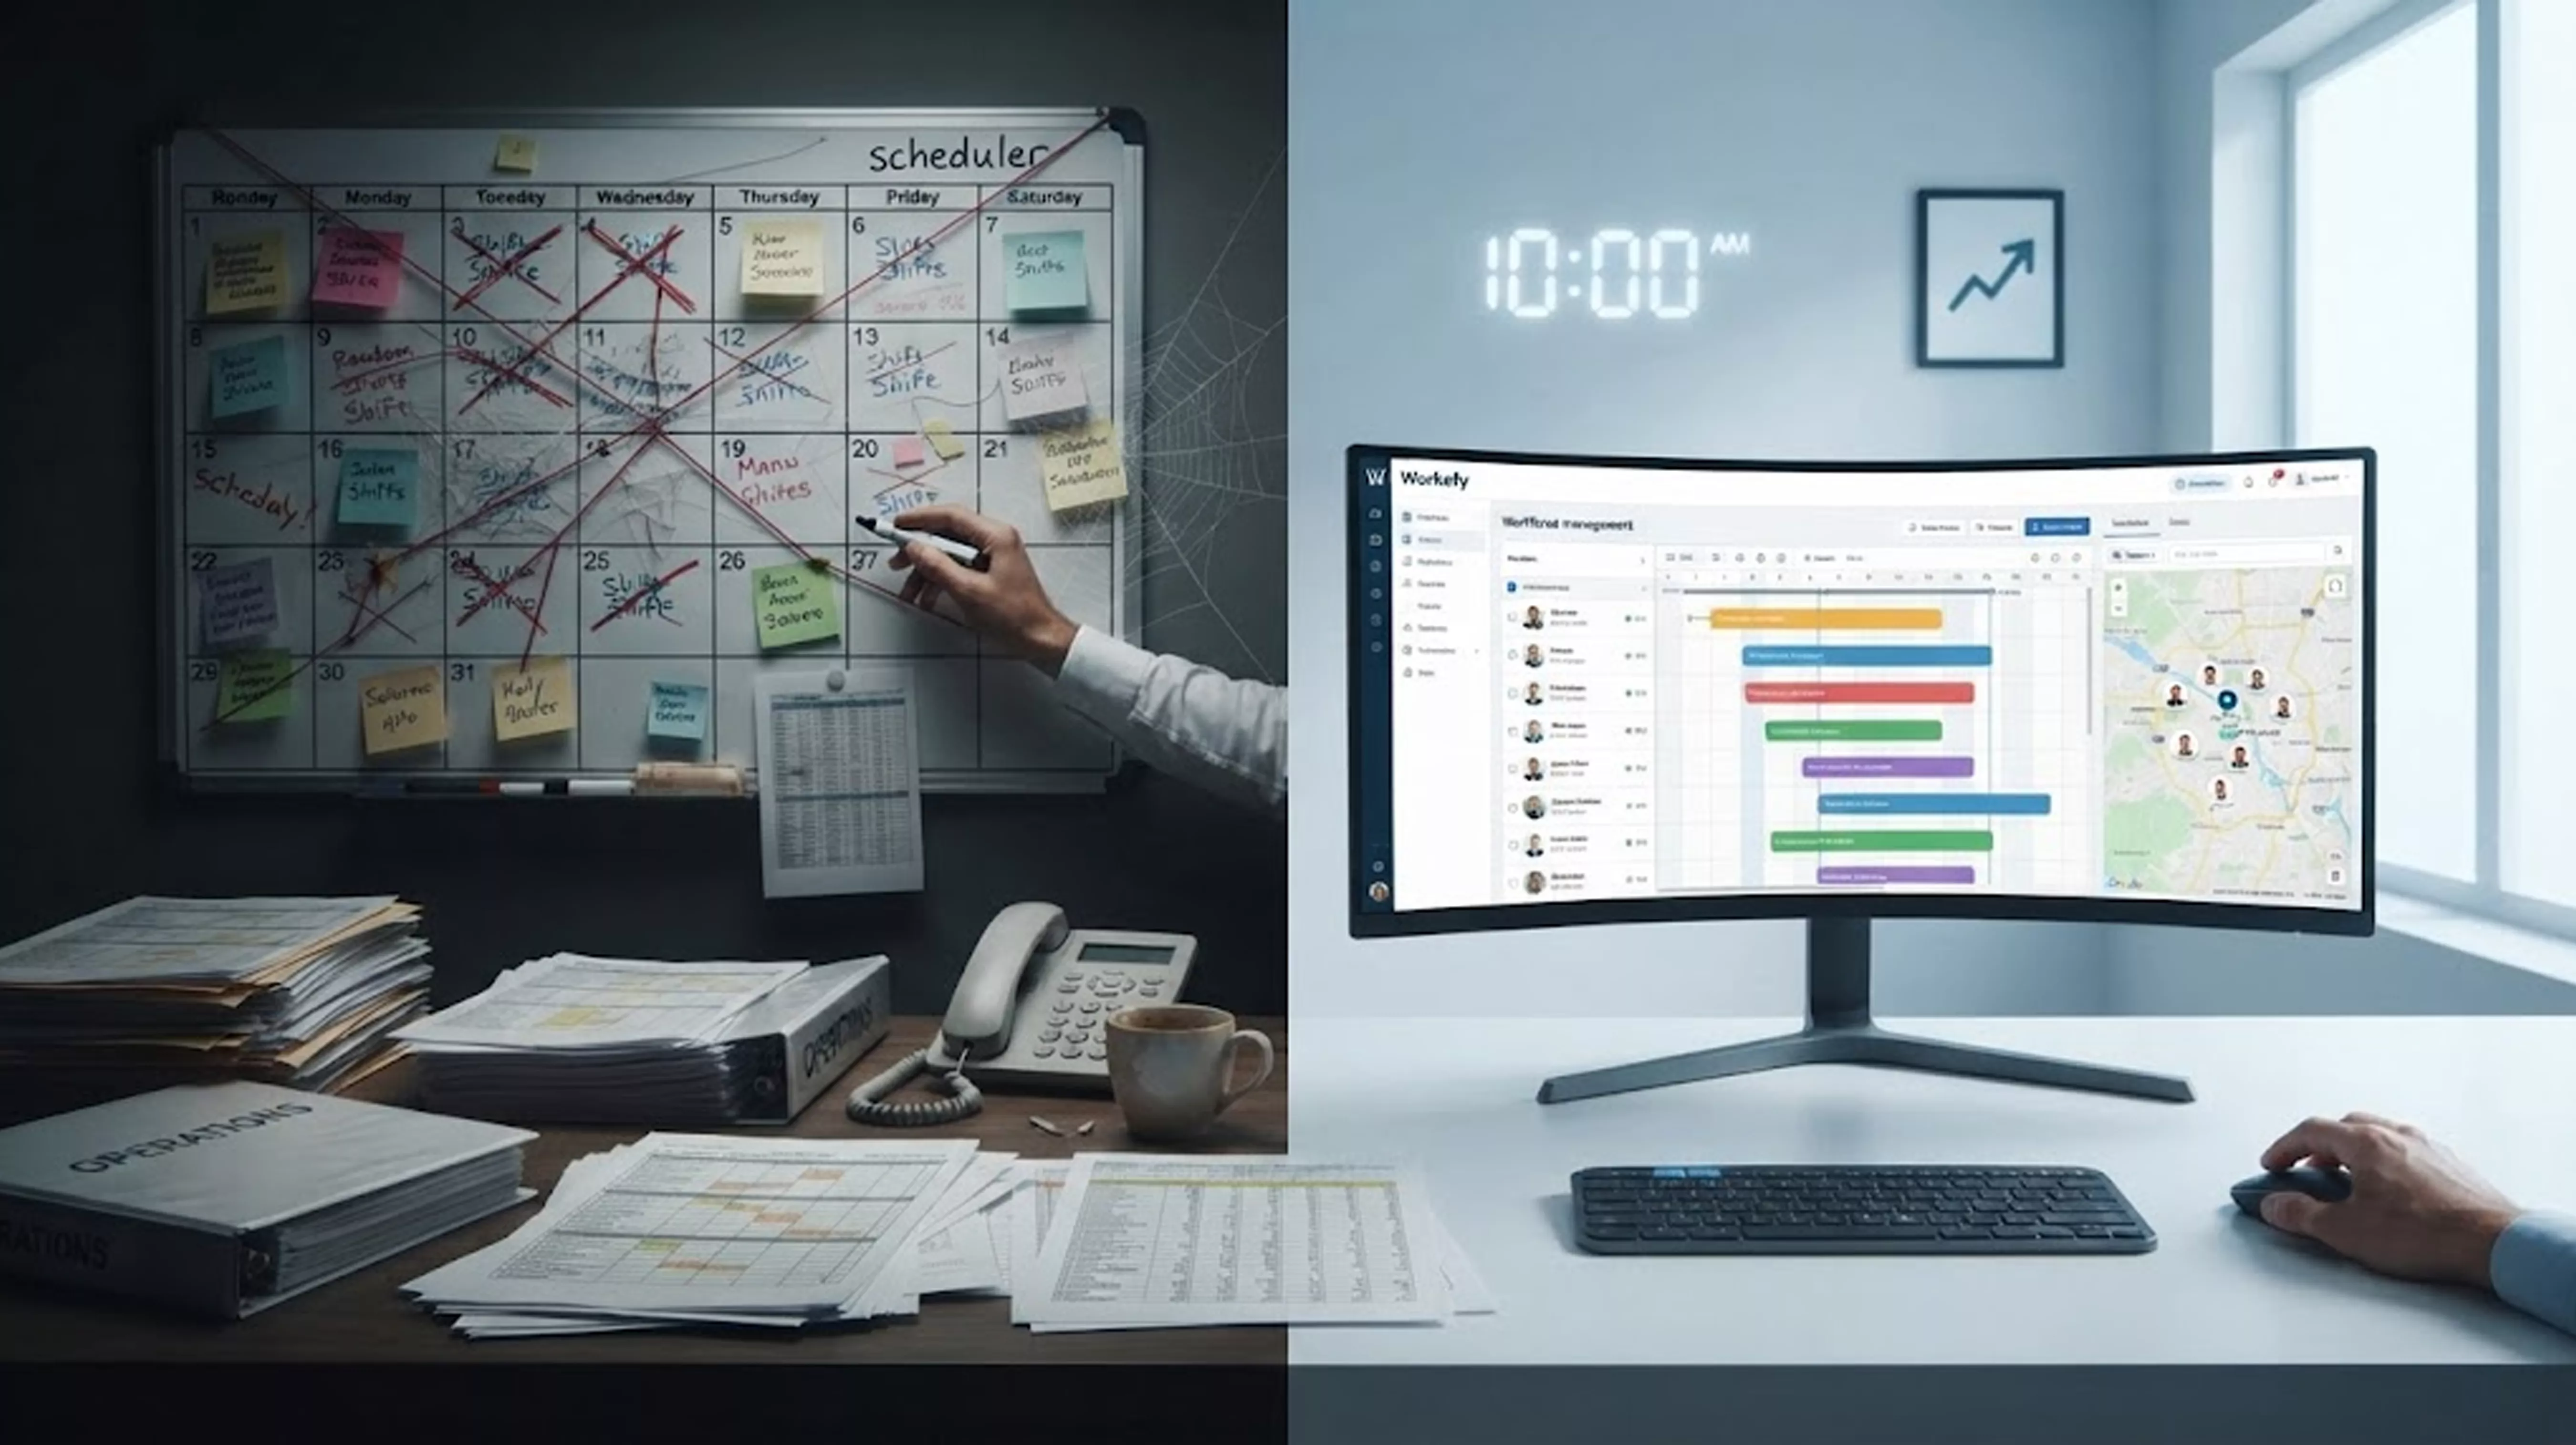
Why Manual Resource Scheduling Is the Hidden Tax on Your Service Business
Learn more →
AI Business Operations Platform: The Future of Connected Workplaces
Learn more →Is Employee Monitoring Legal? Consent, Scope, and Records
Learn more →Want to see how this works in practice?
Tell us how your team runs today and we'll walk you through the parts of Workefy that apply.
Prefer email? Write to contact@workefy.io